2.11 CalibrationLink
Click the Calibration Tab from the Device Manager section.
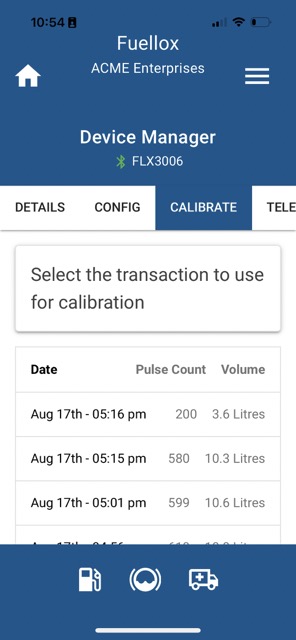
Select a previous transaction, for which you know the correct volume. This would typically be a recent event that was dispensed into a calibration jug. The Volume whould be visually matched to what was on the Dispense Summary just to be sure the correct event is used.
Tap the Transaction to be used for the calibration.
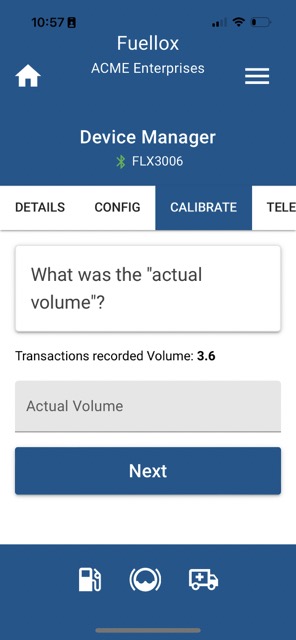
Apply the corrected volume and press Next.
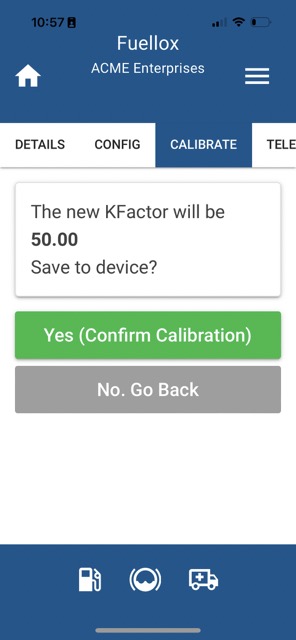
The revised kFactor will be calculated and saved.
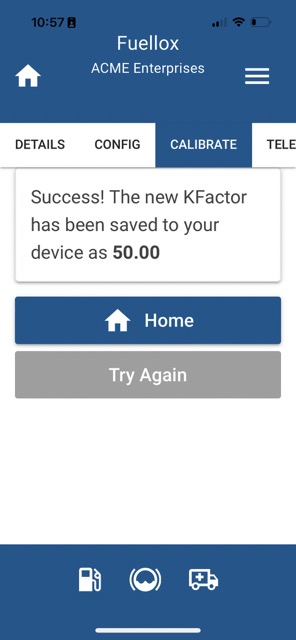
Click Home to back to the main menu.
Warning
Sync your app to update the local kFactor and test the new calibration.
Failure to Sync the app may result in the old kFactor being used for the next event.
.
Dispense another test run into the jug and confirm the calibration is accurate.
2.11.12 Calibrating high flow and large capacity metersLink
On occasion the Fuellox unit will be connected to a bulk meter. In these cases a much larger transaction should be used. Where one can assume the eter is calibrated, use that to complete the calibration.
2.11.13 Advanced CalibrationsLink
Multiple Transactions can be used to complete a linear calibration.
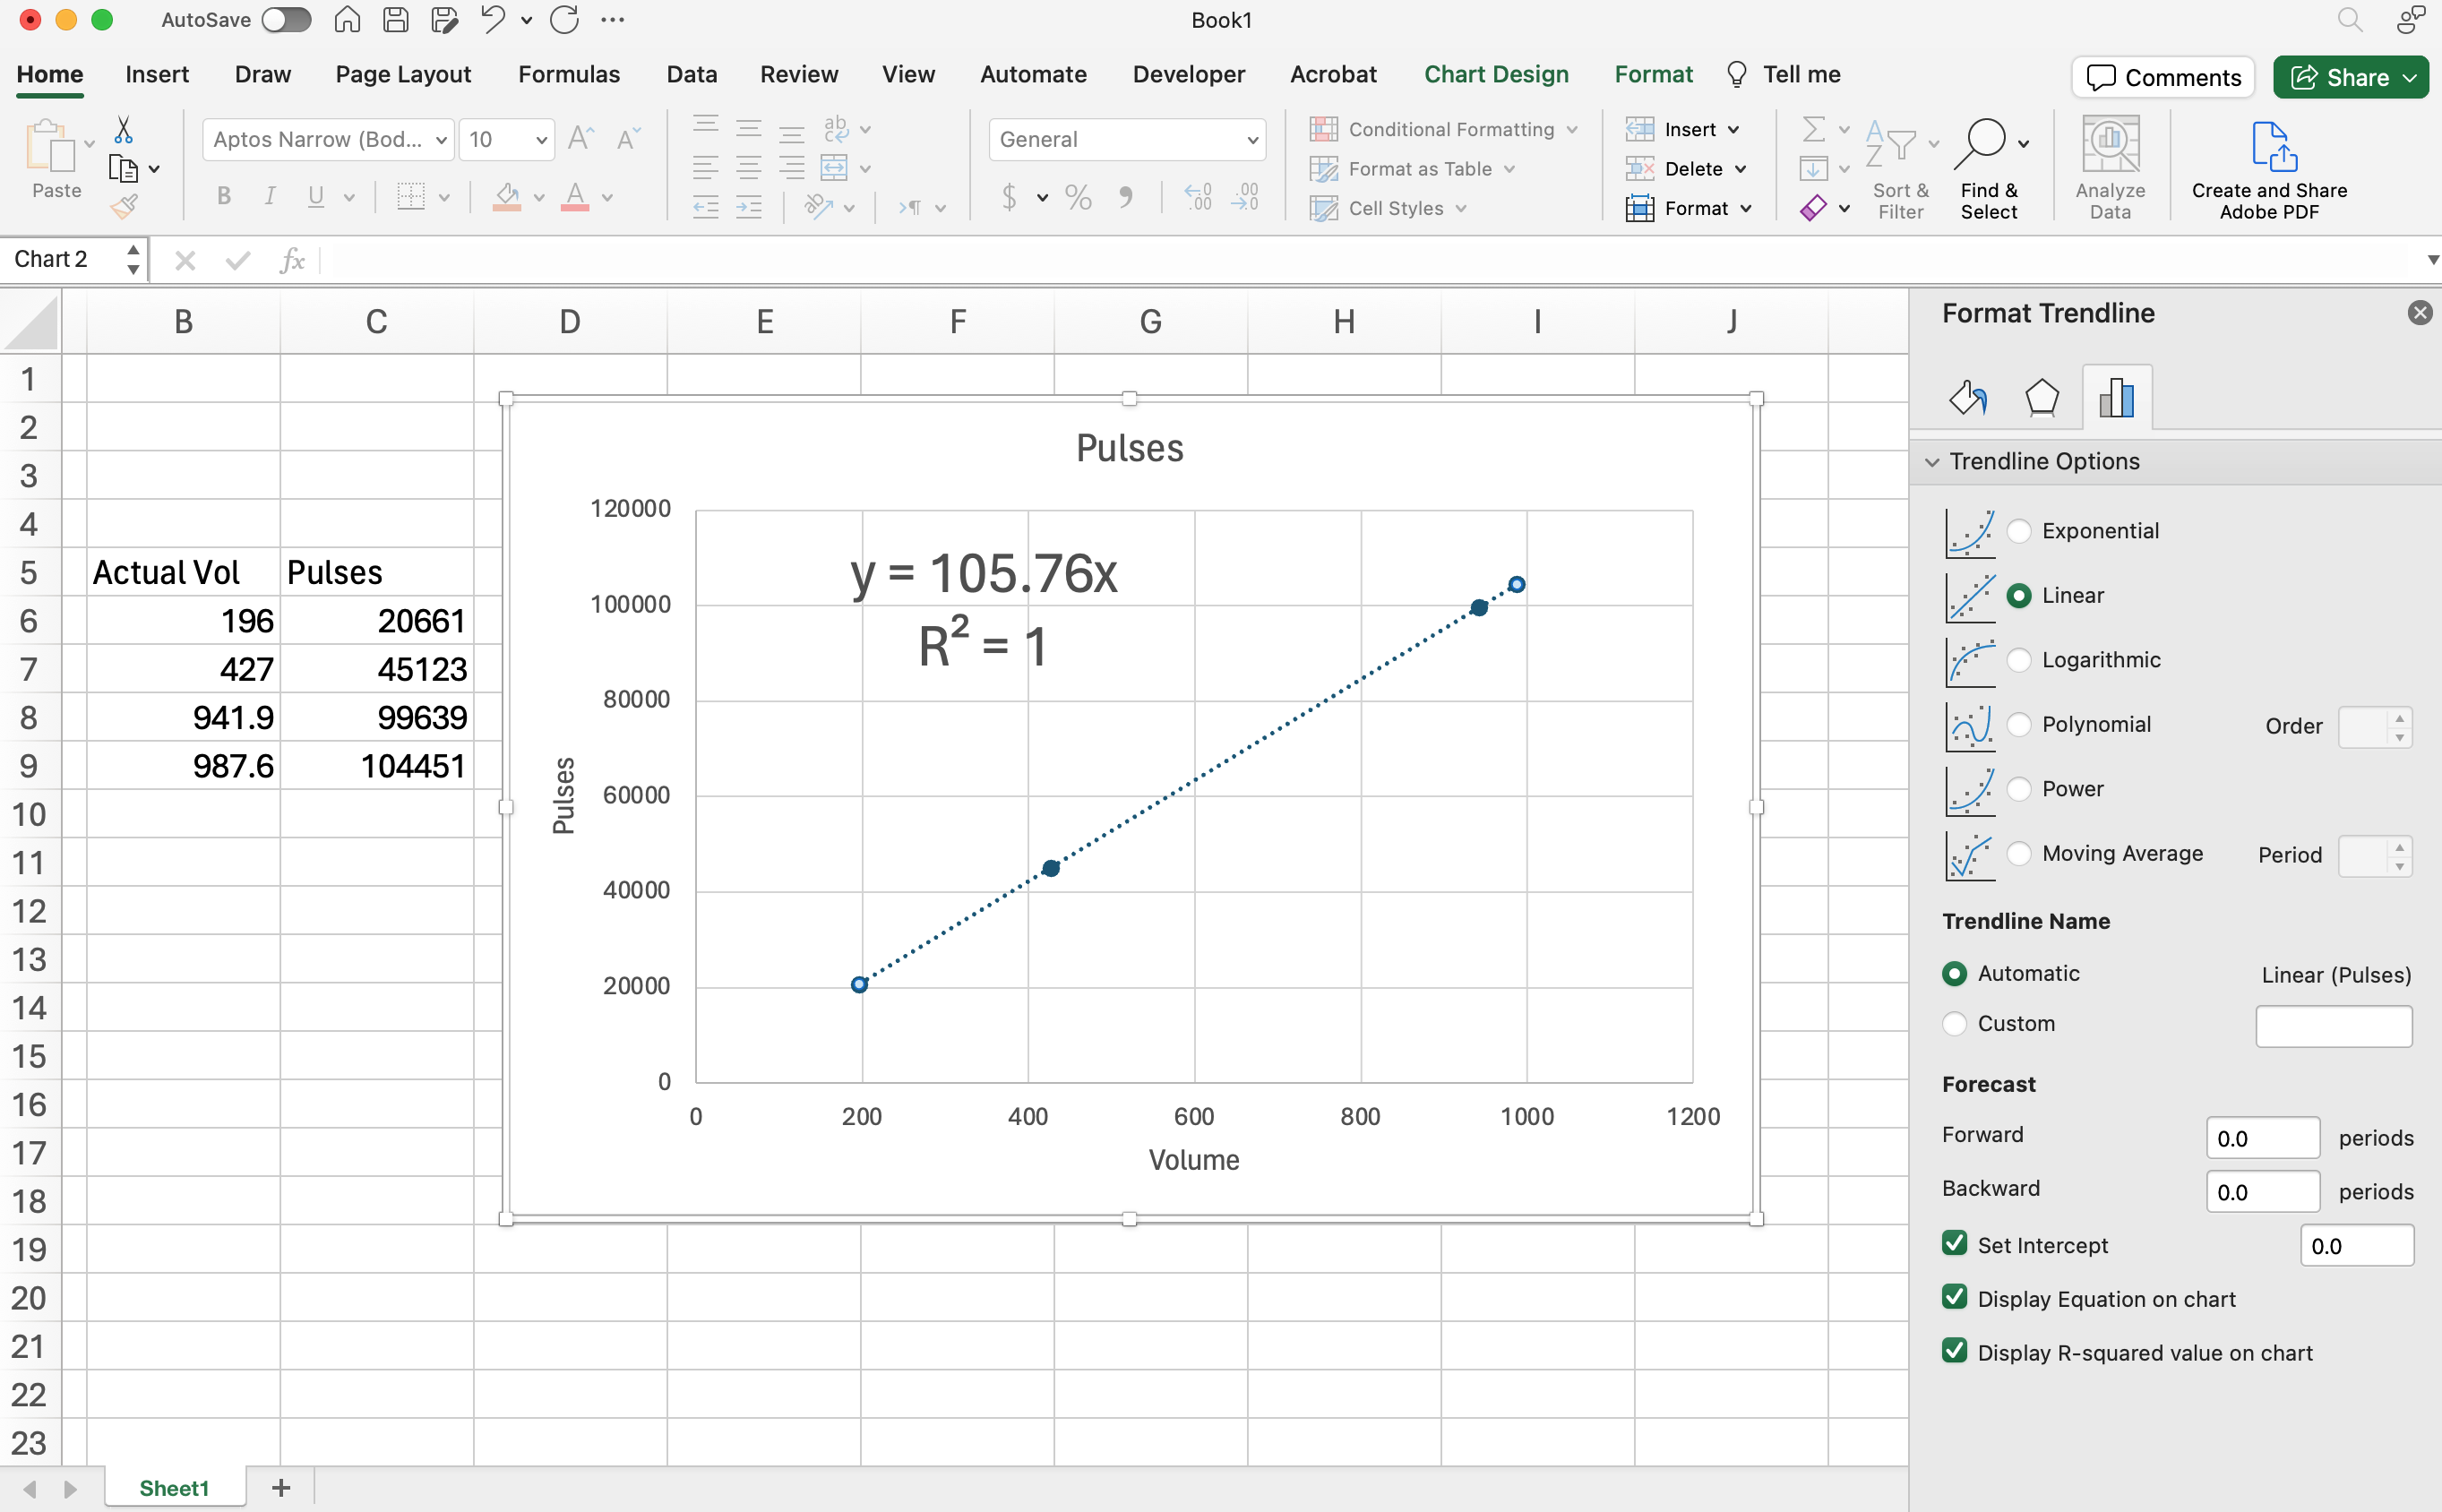
- Use a charting tool like Excel to enter in the Pulses and Actual Volumes*
- Use a point cloud or XY Scatter type cart to display the data
- Add a Trendline to the chart
- set intercept to 0. ie 0 pulses = 0 Litres
- Turn on the Equation
- Display the r-squared
- The Gradient from the Line is the kFactor
Info
* Note on Actual Volumes
Actual Volumes must be from another meter or jug.
Do not use the values presented in Fuellox as they are caluclated from an existing kFactor.
This process allows one to eliminate variation across transactions and can also help to exclude outlier data that may not be useful for the purpose of a calibration.
![]() Download the Excel template for this chart.
Download the Excel template for this chart.
Open the template and overwrite the sample data with your own.
2.11.13.1 Generating the Chart DataLink
Pump fuel into a jug or using an existing calibrated meter. Make note of the fuellox transaction volume, the pulse count and the actual volume. Retail the app_transaction_id if you want to be able to come back to the sample data Overwrite the sample data and enter into the worksheet the actual volume and the pulse count.
If you are using a jug, you can use a cummulative approacg, and just add the samples together. ie Add 2 x 20L transactions to make up a 40L sample point, and add the pulses together as well.
In the screen shot shown we see the following:
- Line gradient
- R Squared
2.11.13.2 Calibration EquationLink
The kFactor is the gradient of this line. In the case the actual kFActor is 105.76
This line is in the form of Y = MX + B where:
- Y represents the volume
- M represents the kFactor
- X represents the number of pulses
- B represents the offset. 0 in our case
2.11.13.3 Calibration R SquaredLink
Statistics :: R Squared shows how well the data fits the 'regression model'.
R Squared represents the quality of fit, and in this case its perfect. 100% fit.